A parent checks the district report card and sees two numbers that don't add up: one school posting strong reading proficiency, another twenty minutes down the highway posting scores half that size. That gap isn't random. It shows up year after year in Iowa's standardized testing data, and it tends to track closely with family income, school funding, and how much instructional time a building actually delivers.
Results Iowa exists to put those numbers in front of citizens without softening them. When we talk about achievement, we mean measurable indicators tied to specific quantifiable objectives, not a general impression of how a district feels. Iowa's biennium reporting cycle gives us a rolling picture of performance, and that picture includes uncomfortable gaps between subgroups of students taking the exact same assessments.
Results Iowa's education dashboard pulls from Iowa Department of Education data, and we cross-reference it against related indicators such as those covered in our breakdown of school funding and student achievement in Iowa. Funding and outcomes are not the same conversation, but they are rarely separable ones either.

What Is an Achievement Gap, Exactly?
An achievement gap is a persistent, measurable difference in academic performance between two identifiable groups of students, most often defined by income, race, disability status, or English learner status, on the same tests under the same conditions. It is a comparison, not a single school's score.
The term gets used loosely in everyday conversation, so it helps to be precise about it. Researchers at Harvard University's Graduate School of Education have documented how these gaps tend to appear early, often before kindergarten, and widen or narrow depending on the interventions a district applies during elementary years. That framing matters for Iowa, where education researchers have found that early gaps in vocabulary and number sense predict later gaps in reading and math proficiency if nothing changes course.
In our tracking of Iowa's Every Child Reads K-12 program, we have seen this pattern hold. Third-grade reading proficiency, measured against ITBS proficiency standards, is one of the clearest early warning indicators available to Iowa policymakers, and Results Iowa treats it as a leading measure rather than a lagging one.
How Does Results Iowa Measure These Gaps?
Measurement starts with disaggregated test data. Instead of reporting a single average score for a school or district, Iowa's accountability framework breaks results out by subgroup, so a citizen can see how students eligible for free and reduced lunch performed compared to their peers on the identical assessment, in the identical semester.
This is standard methodology in education research more broadly. Studies indexed through the National Institutes of Health have linked early socioeconomic disadvantage to measurable gaps in cognitive and academic outcomes that persist without targeted support. A federally funded longitudinal study catalogued in the National Library of Medicine's research database tracked children from early childhood through adolescence and found that gaps present at kindergarten entry rarely close on their own; they require deliberate, sustained programming to narrow.
"Achievement gaps that appear before formal schooling begins tend to persist and even widen without targeted intervention during the elementary years."
Results Iowa applies this same disaggregation logic to its own reporting, and strategic planning documents from the Department of Education spell out quantifiable objectives for closing specific subgroup gaps within defined biennium windows, not vague aspirations to "improve."
What Do Achievement Gaps in Iowa Public Schools Look Like in 2022?
2022 data shows Iowa's statewide proficiency rates recovering unevenly from pandemic-era disruption, with gaps between low-income and non-low-income students in reading and math remaining wider than pre-2020 levels in a majority of tracked districts. Elementary grades show the sharpest divergence, while high school proficiency gaps grew more slowly.
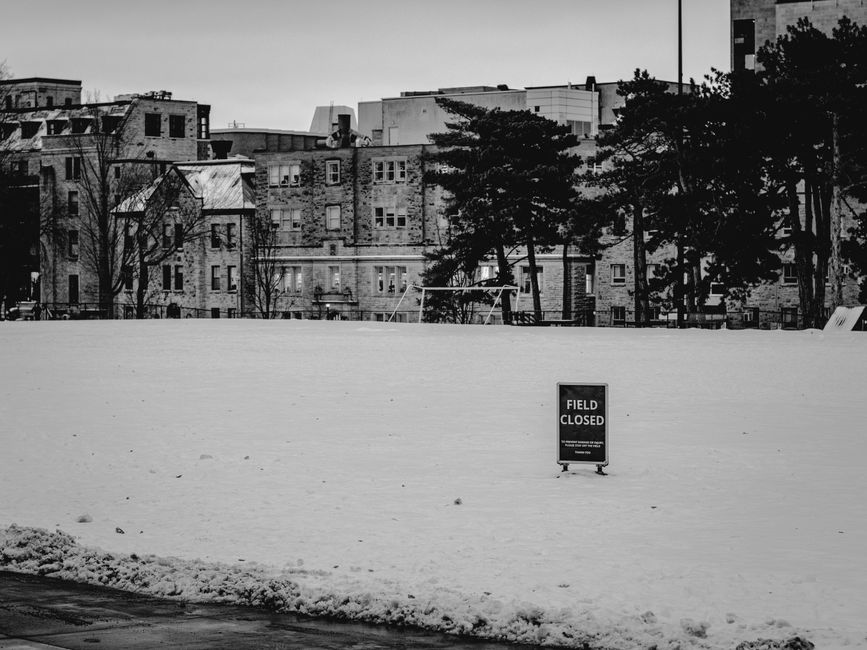
Part of that unevenness traces directly back to closed schools during the 2020 and 2021 disruption. Buildings that shifted to remote or hybrid instruction for extended stretches lost measurable instructional time, and that loss did not land equally. Households with reliable internet and a parent available during the school day absorbed the disruption better than households without either. Results Iowa's data shows this divide clearly when reading scores are broken out by income subgroup rather than reported as a single statewide average.
Weather-related closures add a smaller but real layer on top of that. Iowa winters produce a predictable run of days when citizens search for whether schools closed tomorrow, and while a single snow day rarely moves a proficiency score, districts that accumulate the most closures over a school year tend to show measurably lower gains among their most vulnerable subgroups.
What Are the Root Causes of Academic Achievement Gaps in Iowa Public Schools?
The primary drivers Iowa's data points to are unequal access to early literacy support, disparities in school funding per pupil, chronic absenteeism concentrated in specific subgroups, and lost instructional time from closures during the pandemic. No single factor explains the full gap; they compound.
Our reporting on early literacy programs making an impact in Iowa shows that districts investing early in reading intervention narrow their third-grade proficiency gaps faster than districts that wait until middle school to intervene. By then, the gap has often calcified into a habit rather than a skill deficit, and closing it costs considerably more in staff time and resources.
Special education identification and support quality is another factor citizens often overlook, which we cover in more depth in our piece on special education services quality metrics in Iowa. Districts with stronger early identification tend to show smaller gaps between students with disabilities and their peers by high school.
How Have Achievement Gaps in Iowa Public Schools Shifted Since 2021?
Comparing 2021 to more recent data, Iowa's statewide reading proficiency gap between low-income and non-low-income students narrowed modestly, while the math gap held roughly flat. Districts that invested in tutoring and extended learning time after 2021 posted the largest measurable gains among affected subgroups.
That modest narrowing did not happen uniformly across grade levels. Gains concentrated in elementary schools, where intervention time per student is easiest to expand. Middle schools and high schools showed slower movement, in part because older students carry more accumulated gap into each new school year, and in part because remediation programs for adolescents are harder to staff and schedule around existing coursework.
Whether a family is comparing elementary schools or weighing options among high schools, this is exactly the kind of year-over-year subgroup data Results Iowa was built to surface. Averages hide the story; disaggregated trend lines tell it.
Which Signals Point to a Widening Gap in a Specific School?
Citizens and stakeholders can observe several concrete warning signs at the school or district level before a gap shows up starkly in statewide averages:
- Third-grade reading proficiency below 70 percent among low-income students
- Chronic absenteeism rates above 10 percent in any single subgroup
- A widening spread between free/reduced lunch and non-eligible student scores over two consecutive bienniums
- High teacher turnover concentrated in Title I buildings
- Fewer advanced coursework enrollments among minority or low-income students relative to their share of the student body
- Graduation rate gaps of five points or more between subgroups
- Repeated multi-day closures that are not made up with extended calendar days
Middle schools tend to be where several of these signals compound at once, since that is when course tracking begins in earnest and the gap from elementary years either narrows or hardens into a longer-term pattern.
Is One Statewide Fix the Right Approach for Every District?
No, and Results Iowa's own data argues against a single prescription. A rural district struggling with teacher shortages needs a different intervention than an urban district managing a large English-learner population with strong staffing but tight facility budgets.
Tutoring-heavy models work well where the gap is primarily about lost instructional minutes. Districts facing the aftermath of closed schools have leaned on this approach with real results in reading recovery. But in districts where the gap traces more to chronic absenteeism driven by transportation or housing instability, tutoring alone does little; the student has to be in the building consistently before any curriculum intervention can work. In those cases, attendance support and family outreach outperform additional classroom time.
Results Iowa does not recommend one statewide fix over another. Open measurement means giving citizens and district leaders the disaggregated data to choose the intervention that matches their specific gap, rather than importing a program that worked somewhere else and hoping it transfers.
What Timeline Should Citizens Expect for Closing These Gaps?
Gap closure is a multi-year process, typically tracked across two or more biennium cycles before durable movement shows up in the data. Programs targeting early literacy tend to show measurable results within two to three years; gaps rooted in chronic absenteeism or funding disparities often take longer, closer to five years of sustained effort.
Federal research on pandemic-era learning loss backs up that longer timeline. The Centers for Disease Control and Prevention has published data connecting extended school closures to measurable academic setbacks that took multiple years to recover from, particularly among students who were already behind before 2020.
"Extended school closures during the pandemic were associated with academic setbacks that, for many students, required multiple years of targeted support to recover."
That data lines up with what Results Iowa tracks in our own longitudinal reporting, including our coverage of Iowa K-12 graduation rates and trends, where subgroup gaps in graduation outcomes tend to lag behind gains in earlier grades by roughly a decade. What we are doing about this at the state level is publishing the interim indicators, not just the endpoint numbers, so citizens can judge whether a district is on pace long before a graduation cohort completes.
How Can Iowa Citizens Track Progress in Their Own District?
Watching the right numbers, and watching them consistently, is the most useful thing a parent or community member can do. A few practical habits help:
- Pull subgroup data, not just the district average, from the Results Iowa dashboard each reporting cycle
- Compare third-grade reading proficiency year over year rather than a single snapshot
- Check chronic absenteeism figures alongside test scores, since the two move together
- Look at advanced coursework and college readiness enrollment by subgroup, covered in our college readiness standards across Iowa analysis
- Attend a school board budget meeting at least once to see how funding decisions map to the gaps in the data
- Ask administrators directly what quantifiable objectives they have set for narrowing a specific subgroup gap, and by when
None of these habits require a background in statistics. They require consistency, and a willingness to look past a single flattering or discouraging number.
Closing the gap between Iowa's highest- and lowest-performing student subgroups will not happen through a single policy or a single school year of effort. It happens through transparent reporting that citizens actually read, strategic planning that sets real deadlines, and enough public attention that districts stay accountable to the numbers between elections. Results Iowa publishes the data so that accountability doesn't depend on anyone's memory of last year's scores. Check your district's numbers, compare them against the state trend, and ask your local board what they're doing about the gap that's actually in front of them.